Hello, it might look like an advertisement, but I made this myself, so please take a look. (I will delete it immediately if there is a problem.)
After investing for several years, I thought "It would be nice to have this kind of screen" and made one or two things directly. Before I knew it, it became a site.
I started it just for myself to see, but as I worked hard on it, I thought it might be helpful to others, so I'm sharing it.
■ Main Features
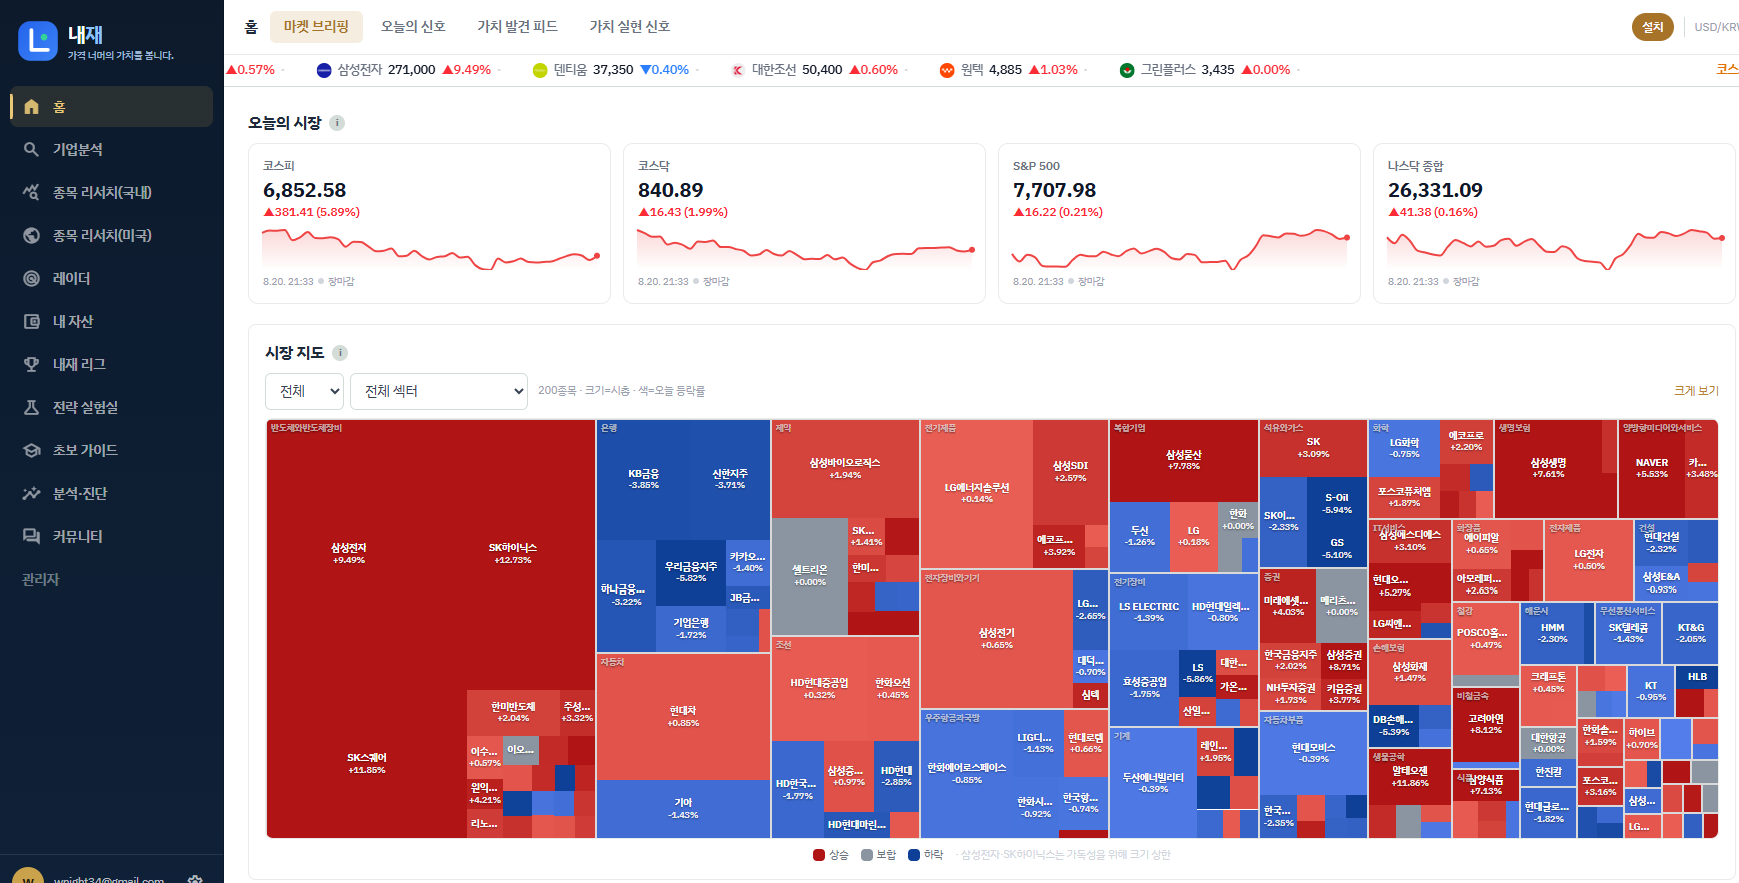
① Market Map (Real-time) — A real-time map that colors market capitalization size × rate of change. NXT after hours (aftermarket) are also reflected.
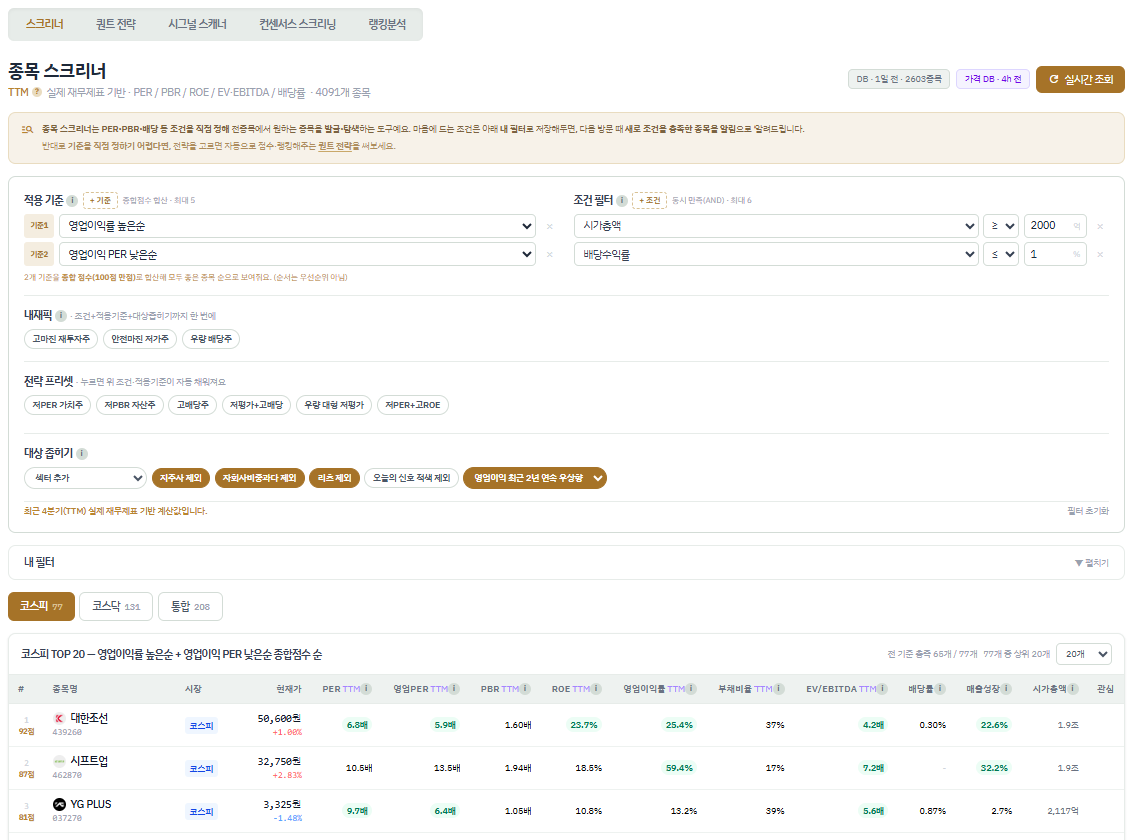
② Stock Research — Stock screening, quant line setting, etc. A tool for discovering and exploring desired stocks from all stocks by directly setting conditions such as PER·PBR·dividend.
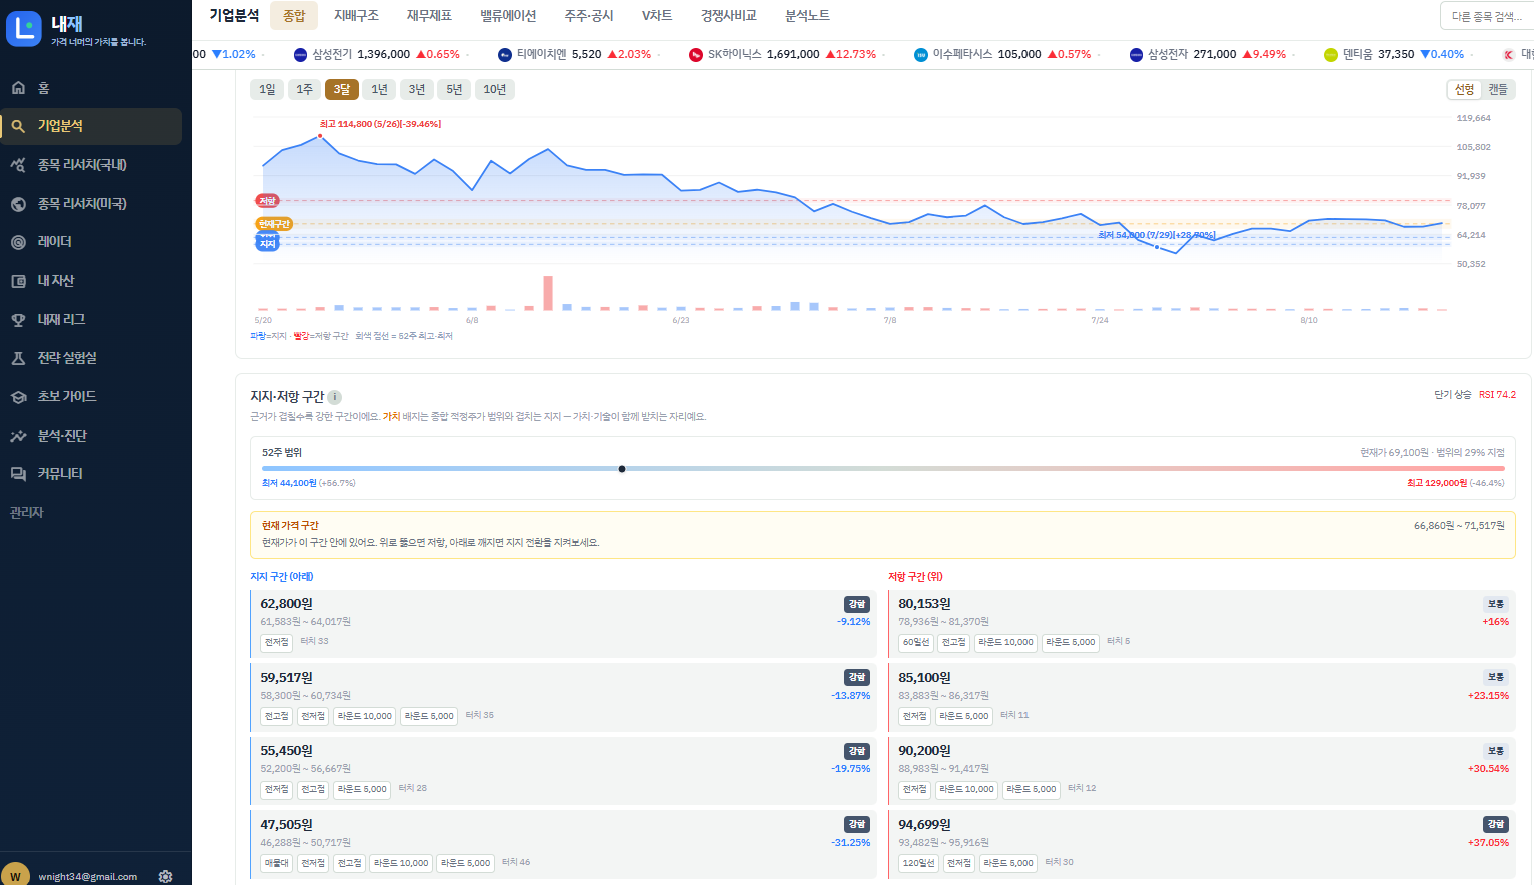
③ Support·Resistance Lines — Automatically calculates points where 5 signals, such as moving averages, trading volume, and past turning points, overlap. A tool that helps you identify buying and selling ranges not with intuition but with data.
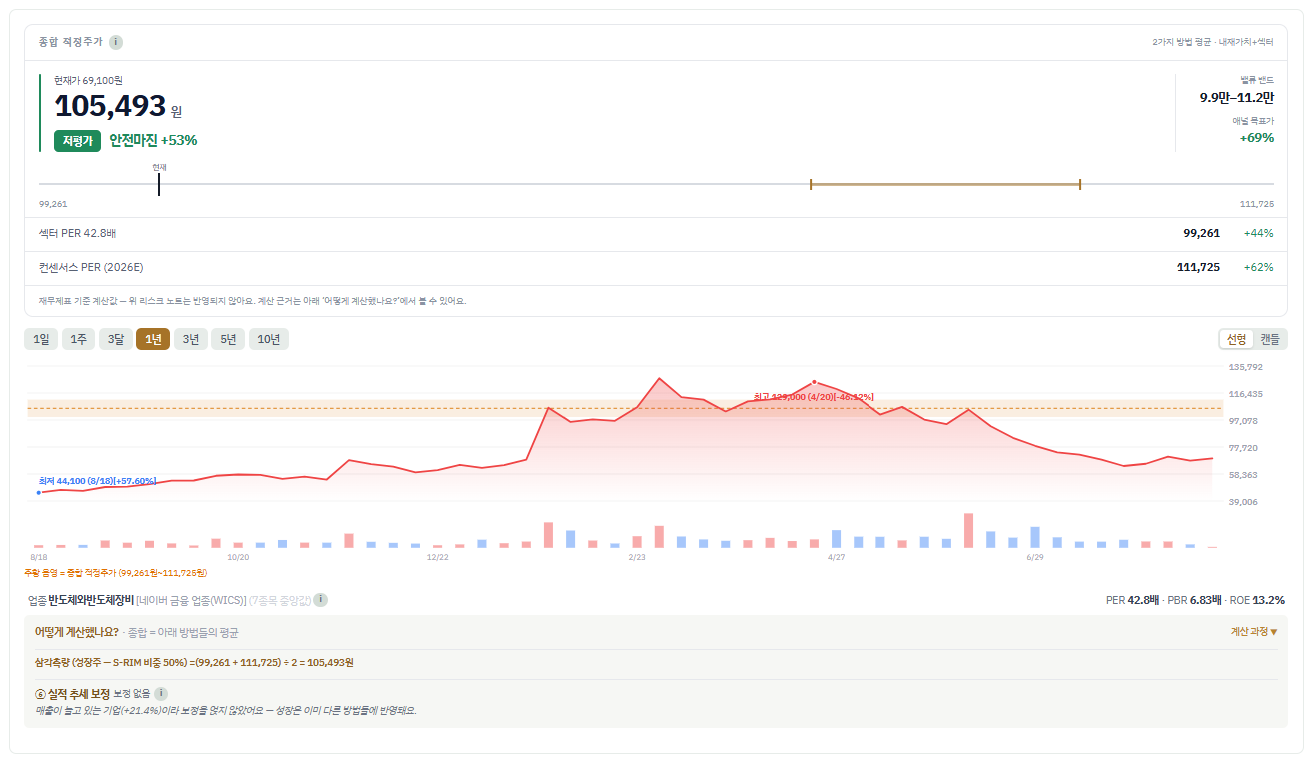
④ Comprehensive Fair Value — Calculates fair value by combining 4 valuation methods, including S-RIM. Shows the gap between the current price and the fair value as a safety margin.
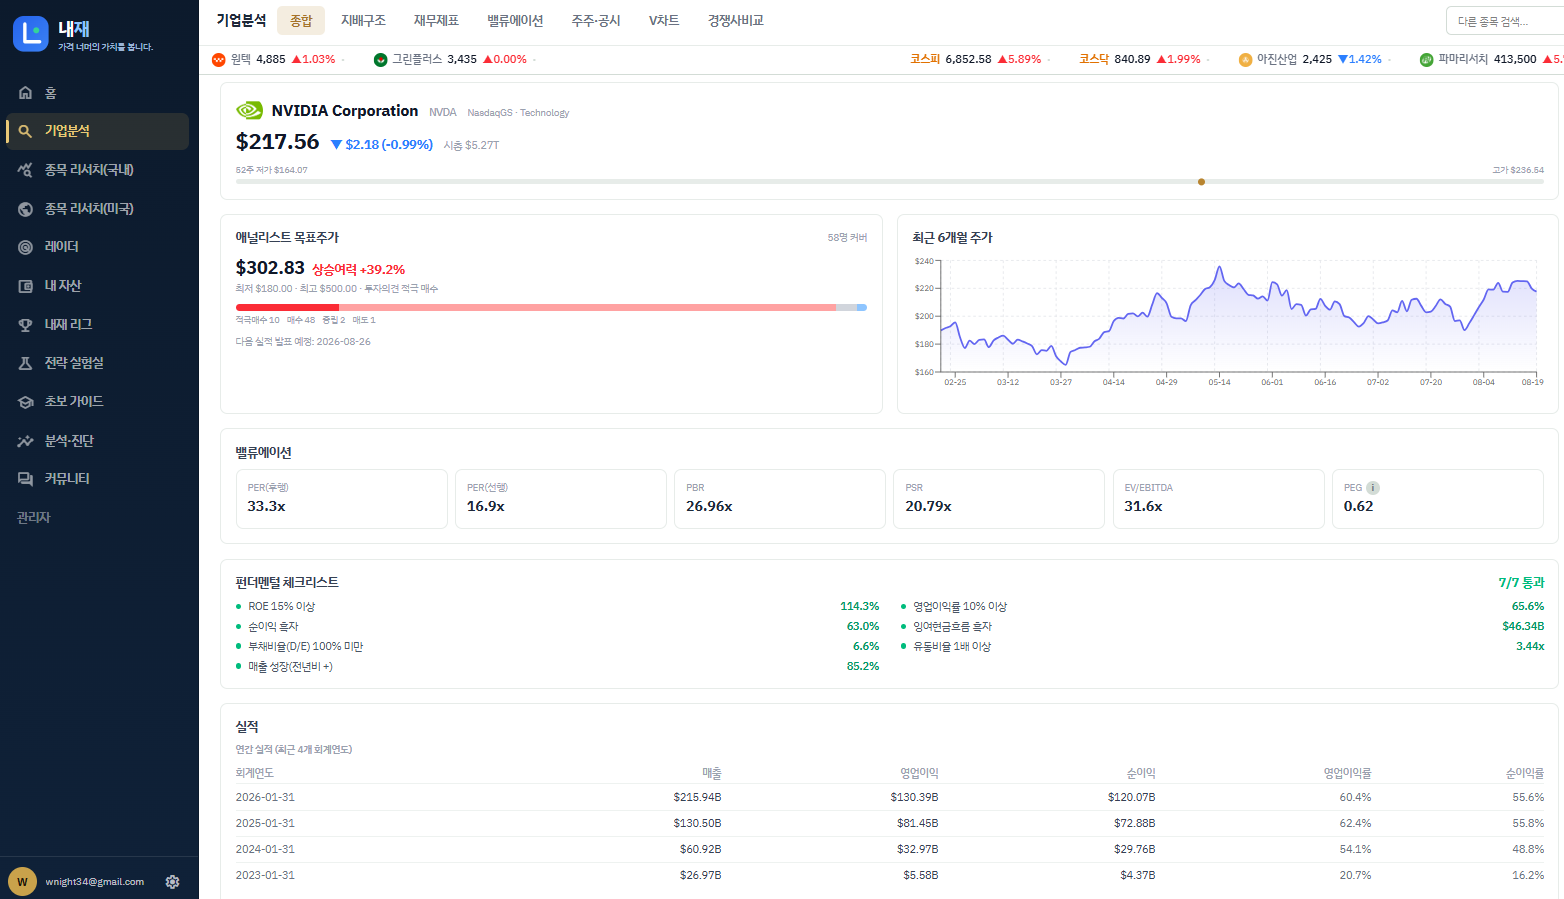
⑤ US Stock Details — Analyzes US stocks such as Apple and Nvidia in the same depth as domestic stocks. Summarizes performance, dividends, valuations, including Alphabet A/C and preferred stock distinctions.
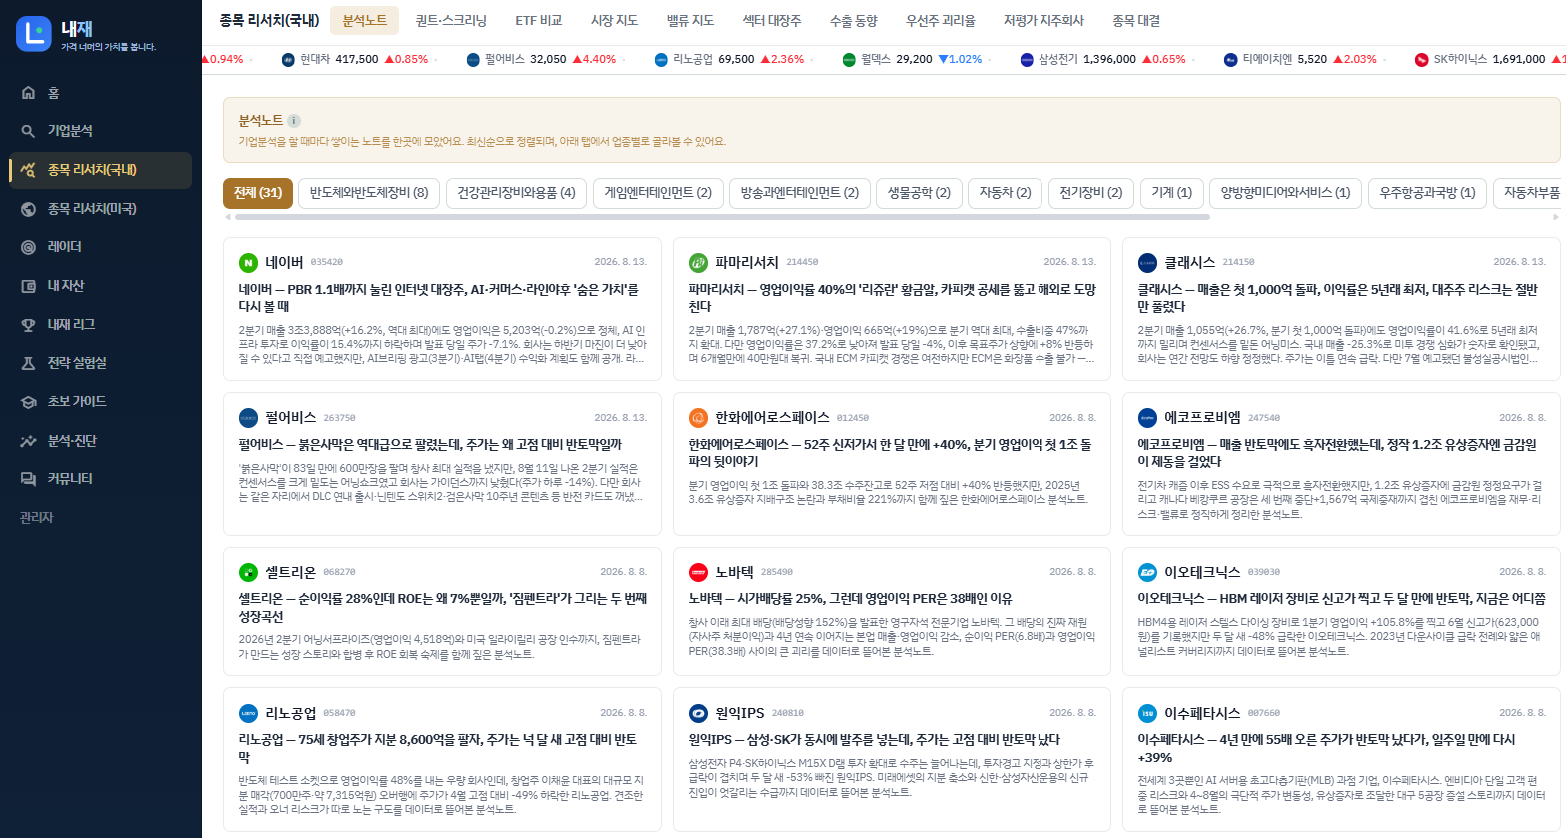
⑥ Analysis Notes — In-depth company analysis that breaks down business models, investment points, and risks with actual figures. Easier than a report and deeper than a video.
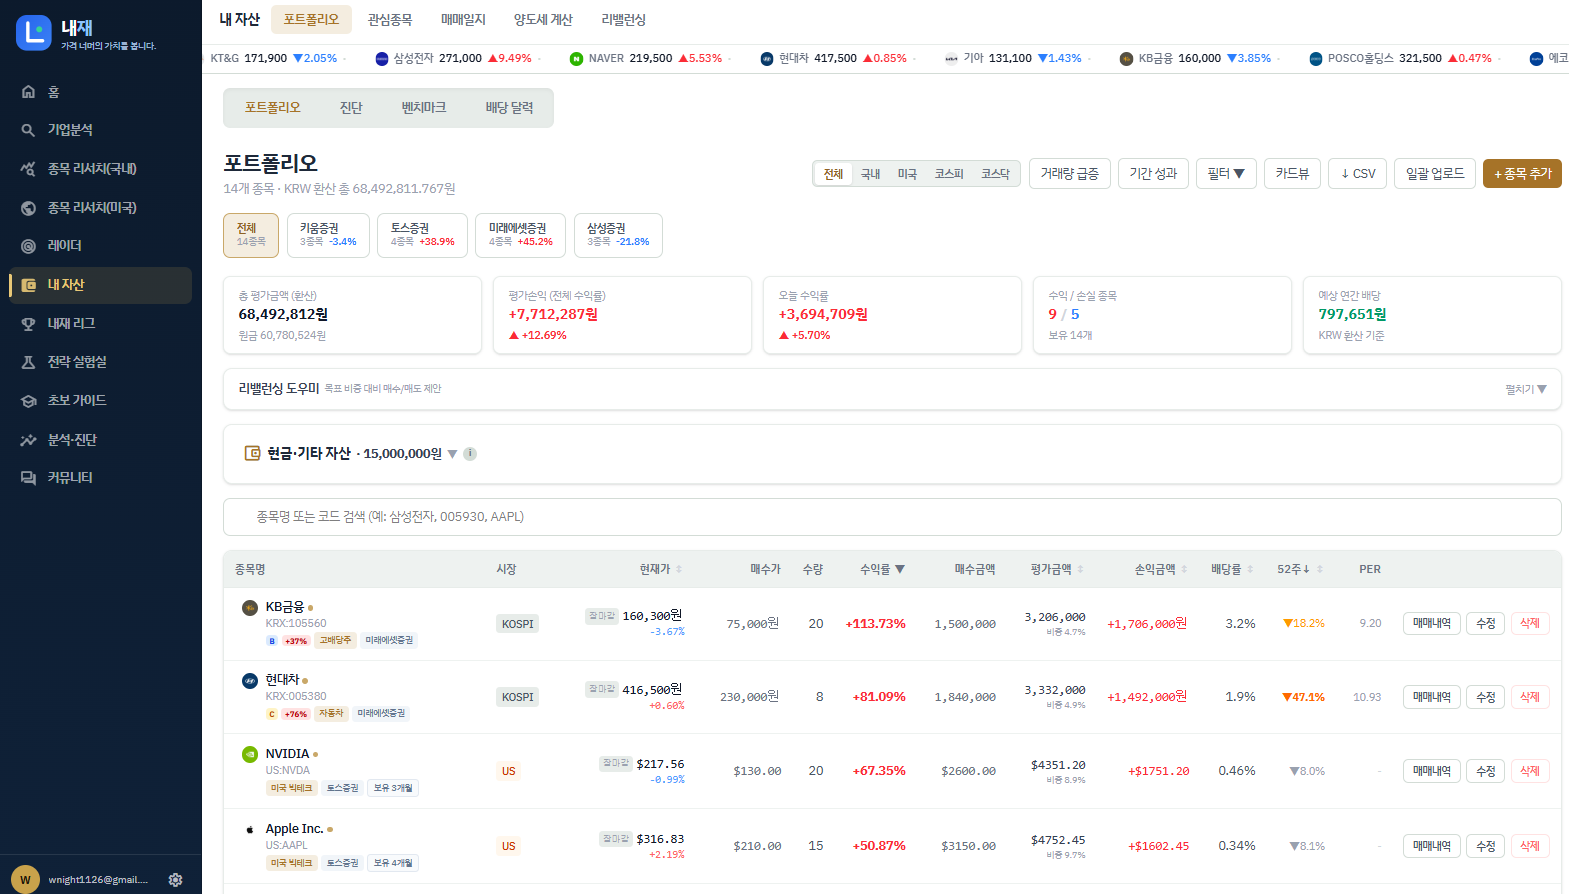
⑦ My Asset Management — Gathers scattered stocks and displays returns and proportions at a glance. A portfolio management tool that diagnoses concentration and risk.
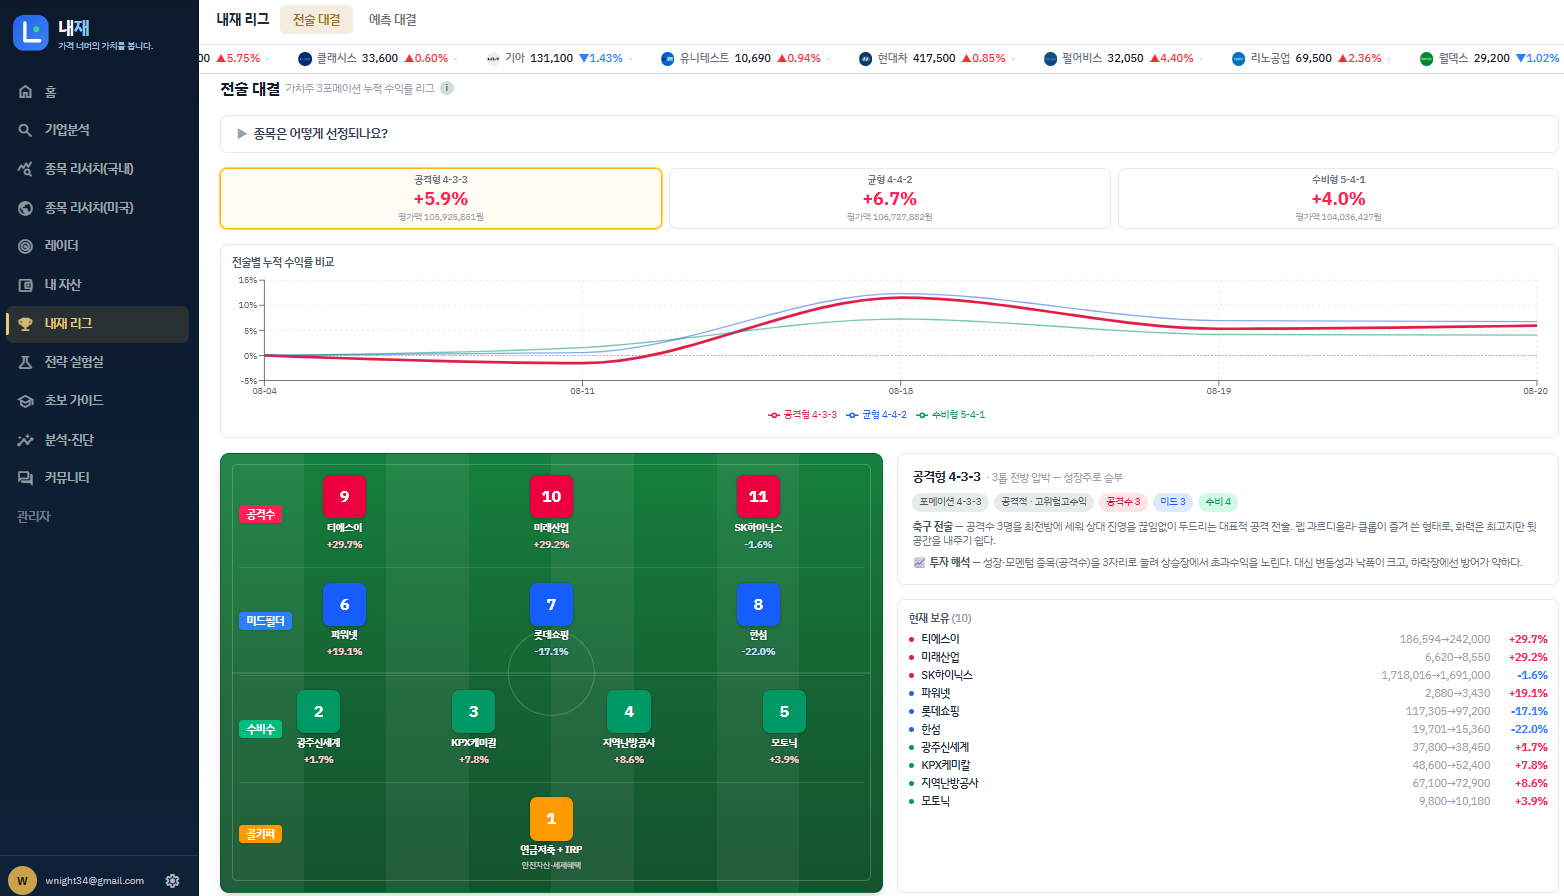
⑧ My Internal League·Tactical Showdown — Predict the future of stocks and get ranked based on actual results. A tool to compete with AI and other investors.
There are many other fun features. All features are free to use once you sign up, so please take a look. If signing up is too much trouble, you can also browse in guest mode.
■ Data
Based on DART electronic disclosure + Korea Investment Securities (KIS) real-time prices. The values are not generated by AI but are calculated from disclosed data and formulas (that's why it can be run for free).
Since I made this as a hobby, there are many shortcomings. Please feel free to leave any comments like "It would be nice if there was also..." and I will try my best to reflect them.
The name of the service is Naejae (Naejae) — meaning "Looking at the value beyond the price".
The address is

Naejae · Naejae — Value Beyond Price
naejae.com
Discover undervalued high-quality stocks based on intrinsic value, and manage them with dividends, capital gains tax, and trading logs.
Easily accessible via mobile. Please use it a lot.
Thank you.
(Administrator, please delete if this promotional post violates the board regulations.)
▶ Original source: https://naejae.com

