6/2 Asset Market - U.S. Stock Market Extends All-Time High Rally Despite Bitcoin Plunge
# June 02, 2026 Macroeconomic Daily Market Report
## 1. Market Overview at a Glance Today
Today's keyword for the U.S. macro market is "diverging flows in risk assets."
- U.S. Stocks: S&P 500, Nasdaq, and Dow all rose slightly, continuing the rally near all-time highs (SPY +0.18%, QQQ +0.53%, DIA +0.51%). This aligns with reporting from individual news sources that "the U.S. stock market closed higher on strength in large technology stocks like Nvidia." (washingtonpost.com)
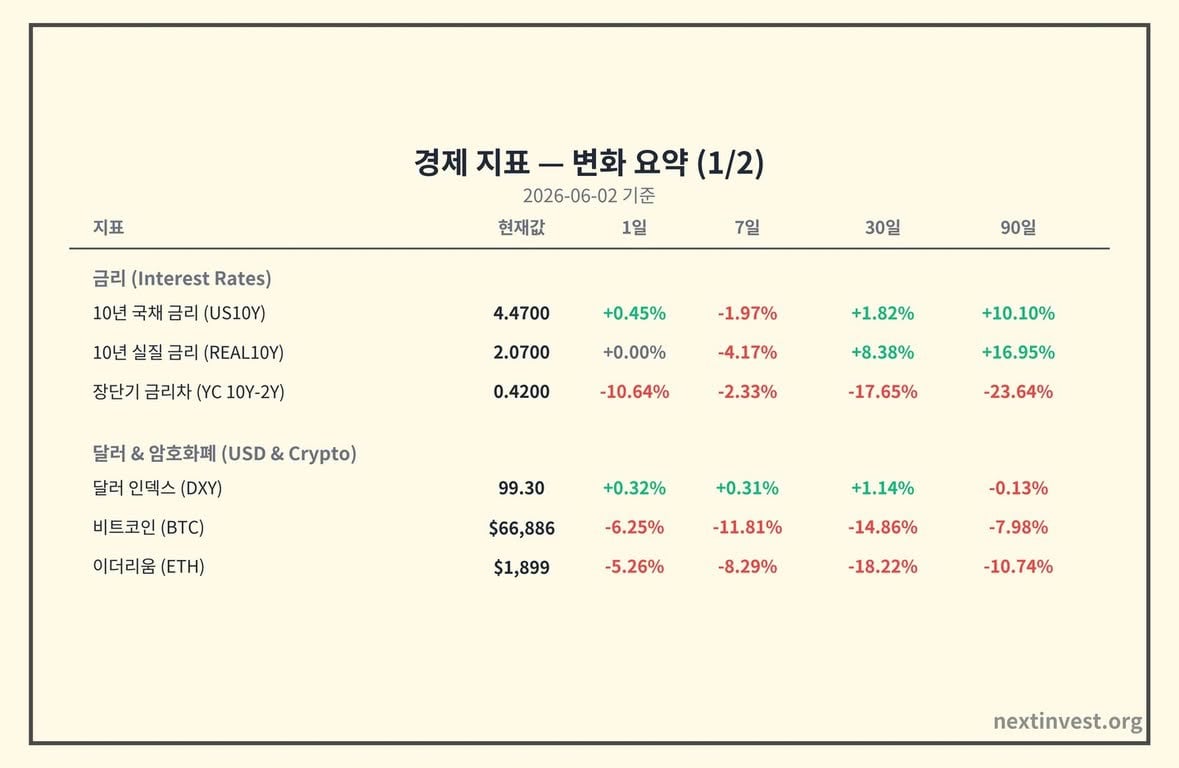
- U.S. Bonds: The 10-year Treasury yield stands at 4.47%, with a gain of 0.45 basis points rather than 0.45% absolute, showing measured movement given recent volatility.
- Dollar: The Dollar Index (DXY) rose slightly to 99.30, up +0.32%.
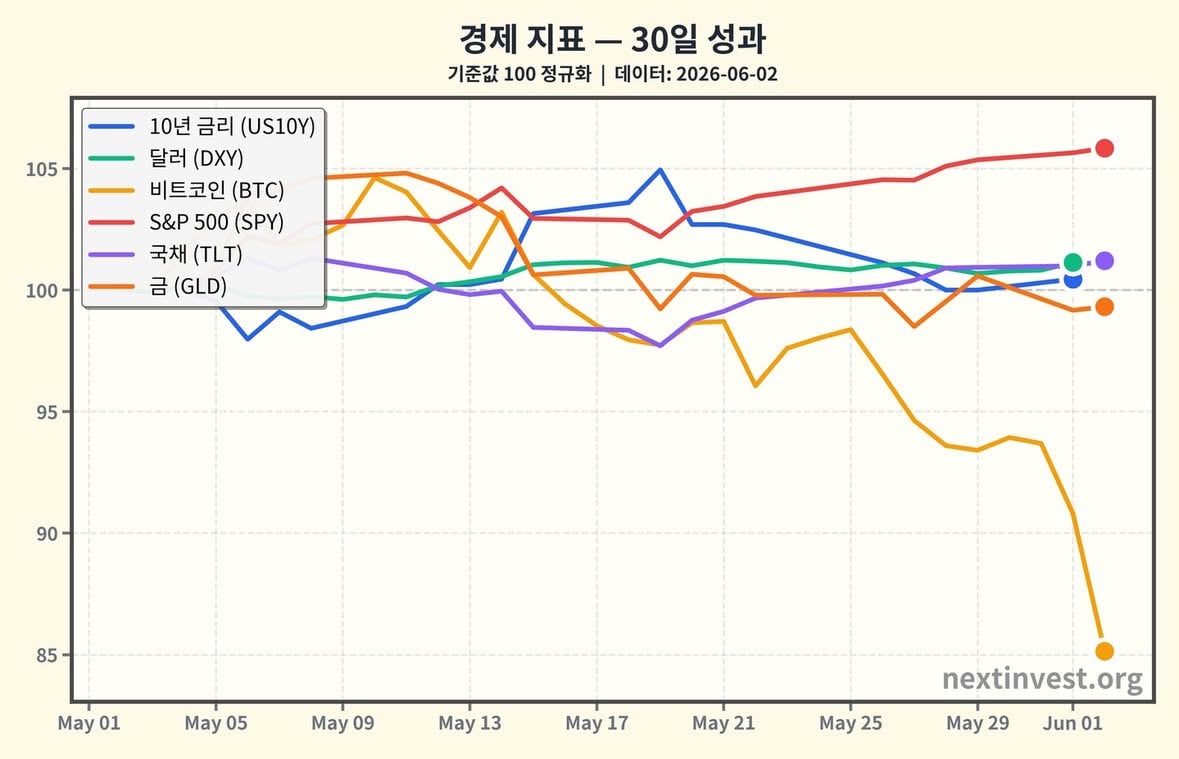
- Cryptocurrency: Bitcoin plunged -6.25% in a single day to $66,886, and Ethereum fell -5.26% to around $1,899. This aligns with reporting from multiple articles today describing "Bitcoin falling below $70,000 with declines of over 4-5% in a day, reaching its lowest level in two months." (coinstats.app)
What does this mean for investors?
- Traditional financial markets (stocks, bonds, dollar) are maintaining "cautious optimism."
- In contrast, cryptocurrency is experiencing near-term shocks from institutional capital outflows and leverage liquidations.
---
## 2. Interest Rates & Bonds: "Waiting Mode" Without Major News
### 2-1. Today's Movement
- 10-year Treasury yield: 4.47% (vs. previous day +0.45%)
- 10-year Real Yield (TIPS): 2.07% (vs. previous day 0% change)
- Yield Curve Steepness (10-year minus 2-year): 0.42 (vs. previous day -10.64%)
Think of real yield as "interest rate minus inflation." The higher the real yield, the more attractive it becomes to hold cash or invest in bonds, while it tends to pressure risk assets like growth stocks and technology stocks.
Today:
- The nominal 10-year yield rose slightly,
- Real yield remained unchanged,
- The yield curve flattened somewhat (spread compression).
This interpretation aligns with the view that today's bond market was adjusting positions only slightly while awaiting upcoming economic indicators rather than responding to major news. Some bond commentaries noted that "with employment and demand data coming later, bonds are playing a slight safe-haven role due to geopolitical risks." (reddit.com)
### 2-2. Long-term Trend Context
- The Federal Reserve's policy rate (FFR) has been on a downward trend since November 2024, declining from 5.33% to 3.63%, a drop of roughly -22%.
- The 10-year yield has also been on a gentle downward trend since its October 2023 peak of 4.8%, now at 4.48%.
- The 10-year real yield has declined slightly from its end-2023 peak of 2.2% to 2.04%.
In other words, over the past 1-2 years:
- We are transitioning from a "very restrictive" phase
- To a "still restrictive but gradually easing" medium-term easing cycle.
What does this mean for investors?
- Long-term rates and real yields have come down slightly from their peaks, so the extreme pressure on both stocks and long-duration bonds is somewhat easing.
- However, with real yields still in the 2% range, the discount rate applied to growth stocks and high-valuation assets remains in place.
- On days like today when rates don't move much, individual news items (particularly cryptocurrency and sector news like AI and semiconductors) tend to drive the market more.
---
## 3. Stocks: Quiet All-Time High Rally Led by AI and Large Technology Stocks
### 3-1. Today's Index Movement
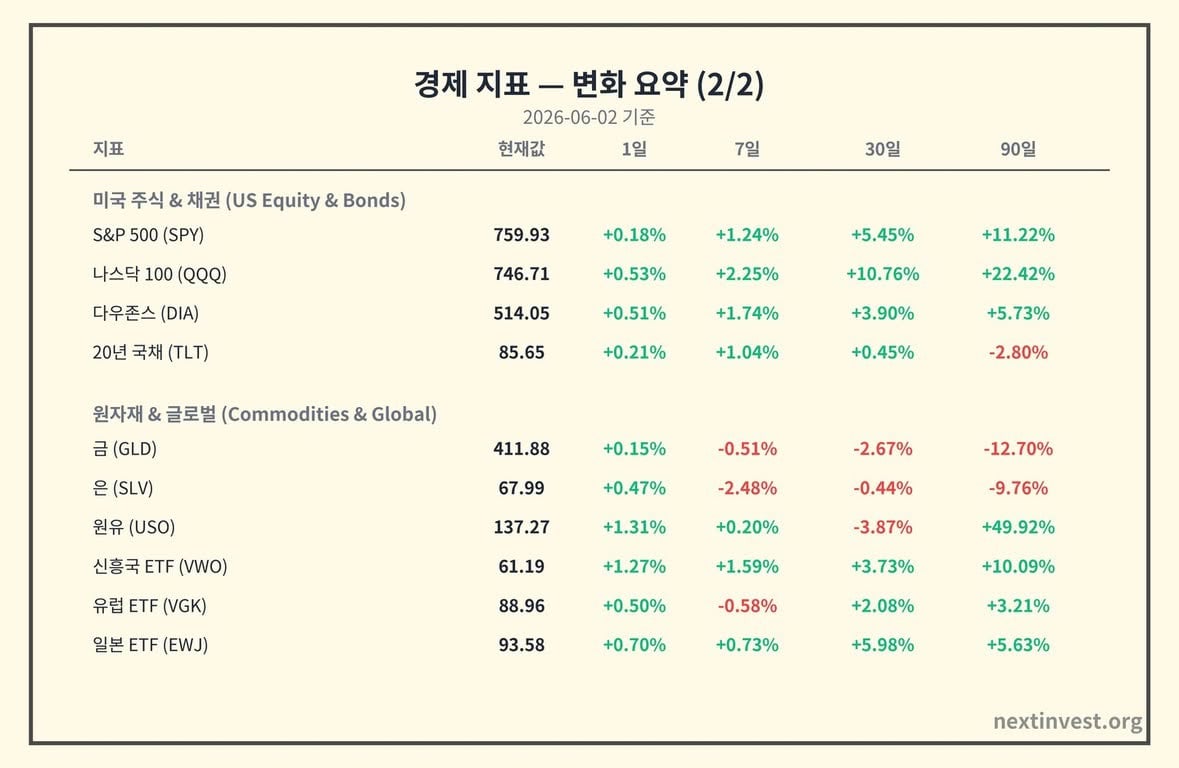
- S&P 500 ETF (SPY): 759.93 (+0.18%)
→ While the index itself rose marginally, it has already accumulated gains of +5.45% over 30 days and +11.22% over 90 days
- Nasdaq 100 ETF (QQQ): 746.71 (+0.53%)
→ Up +10.76% over 30 days and +22.42% over 90 days, showing continued strength in growth stocks centered on AI and semiconductors
- Dow ETF (DIA): 514.05 (+0.51%)
→ Even traditional cyclical and dividend stocks are rising gently in lockstep
Actual news reports repeat the theme that "big tech like Nvidia is driving the Nasdaq and S&P 500 to close higher again, with the Dow also rising modestly." (washingtonpost.com)
### 3-2. Why Is It Rising? (Cause and Effect)
Cause 1: Gradual Rate Environment + Soft Landing Expectations
- As we saw earlier, policy rates and long-term rates have come down from their peaks.
- With unemployment in the low 4% range and industrial production on a gentle upward trend since early 2025, the market's base case assumes a "soft landing" scenario where growth slows but doesn't deteriorate sharply.
Cause 2: Structural Expectations for AI and Big Tech
- The fact that QQQ has surged over 22% in the past 90 days means capital continues to flow into AI infrastructure, semiconductors, and cloud.
- This is not a response to near-term news but rather a bet on the long-term growth story that "earnings could grow significantly over the next several years."
Result:
- Even on days like today when the index appears to rise only +0.2-0.5%, given that the accumulated return over the past three months is already in the double digits, a fairly "overheated quiet bull market" is underway.
What does this mean for investors?
- In the short term: The index is rising steadily upward, but high 90-day returns mean a correction of 5-10% would not be surprising at this stage.
- In the long term: The fact that stock prices have risen this much despite still-elevated real yields is a signal that expectations for AI and big tech earnings growth are very high.
→ If you are holding index ETFs, you should be aware that you are in an "overheated + strong momentum" phase and should reassess your risk tolerance.
---
## 4. Cryptocurrency: Bitcoin's $70,000 Collapse—Why Such a Large Decline?
### 4-1. Today's Numbers
- Bitcoin (BTC): $66,886 (-6.25% / 1 day)
→ 7 days -11.81%, 30 days -14.86%, 90 days -7.98%
- Ethereum (ETH): $1,899 (-5.26% / 1 day)
→ 7 days -8.29%, 30 days -18.22%
According to multiple news sources and data, Bitcoin fell from around $73,000 to below $70,000 within two days, and on some exchanges dropped as low as the $68,000–$69,000 range, declining more than 4–5% in a single day.(coinstats.app)
Our data (closing price basis: $66,886) reflects this steeper decline, including the intraday fluctuations.
### 4-2. Causes: The Triple Threat of 'ETF Outflows + Leveraged Liquidations + Geopolitical Risk'
Synthesizing today's news coverage, there are three major factors behind Bitcoin's sharp drop.
1. Outflows from Bitcoin ETFs
- Over the past 30 days, net outflows of $2–2.5 billion have continued from spot Bitcoin ETFs, with reports indicating 11 consecutive days of net outflows through today.(coinstats.app)
- ETFs are the channel through which institutional and retail investors invest "officially" in Bitcoin, so money flowing out is a signal that enthusiasm among medium- to long-term investors is cooling.
2. Forced Liquidation of Leveraged Positions
- According to some reports, hundreds of millions of dollars in long positions were forcibly liquidated over the course of today.(coinmarketcap.com)
- When Bitcoin's price falls below a certain level, accounts of investors who bought on borrowed money cannot hold on and are automatically sold (margin calls / liquidations), which further accelerates the decline in a self-reinforcing cycle.
3. Geopolitical and Macro Uncertainty
- News such as escalating Middle East tensions and partial selling by large holders (e.g., reports in some articles of 'Strategy' selling Bitcoin for the first time in four years) is dampening investor sentiment.(moneycontrol.com)
- At the same time, with major U.S. economic indicators set to be released later this week, a "let's pause for now" mentality toward risk assets overall is also at play.
Result:
- With medium- to long-term demand already reduced by ETF outflows,
- A market with accumulated short-term leveraged positions was caught in a chain reaction of price decline → forced liquidations → further decline,
- And geopolitical risk and large-holder selling news acted as a "psychological trigger,"
→ Leading to a sharp drop that pushed Bitcoin below the $70,000 level.
### 4-3. Comparison with Stocks and Bonds
What is notable is that despite such a significant Bitcoin correction:
- U.S. stock indices actually rose slightly,
- Treasury yields and the dollar remained little changed, staying within a narrow range.
In other words, today's sharp drop was an event driven by "crypto-internal factors (ETFs, leverage, sentiment)," and was not a move in which traditional financial markets broadly participated.
What does this mean for investors?
- For investors holding Bitcoin or Ethereum,
- This is a reminder that "this level of volatility is a built-in feature of these assets."
- Large swings in either direction over short periods are possible, depending on ETF fund flows and leverage ratios (exchange funding rates, open interest, etc.).
- For those whose portfolios are primarily in equities,
- Today's sharp drop is also a signal that it is still too early to view this as the beginning of a broad risk-off move (large-scale flight from risk assets) across all markets.
- However, since crypto often moves as the most sensitive "leading risk indicator," it is worth watching whether stock market volatility increases over the next few weeks.
---
## 5. Dollar & Commodities: Dollar Slightly Stronger, Gold/Silver/Oil Show Mixed Moves
### 5-1. Dollar Index (DXY)
- Today: 99.30 (+0.32%)
- 30 days: +1.14%, 90 days: -0.13%
This shows that even though U.S. interest rates remain relatively high, the dollar has settled to a level one step below its peak from a year ago.
What this means for investors:
- When investing in non-U.S. assets (emerging markets, European, or Japanese equities), the currency headwind is less severe than it was one to two years ago.
- However, on days like today when the dollar is slightly stronger, it can act as a short-term headwind for emerging market and commodity assets.
### 5-2. Gold, Silver, and Crude Oil ETFs
- Gold (GLD): 411.88 (+0.15% / 1 day, 90 days -12.70%)
- Silver (SLV): 67.99 (+0.47% / 1 day, 90 days -9.76%)
- Crude Oil (USO): 137.27 (+1.31% / 1 day, 90 days +49.92%)
Interpretation
- Over the past three months, gold and silver have fallen by double digits, suggesting this is less a "safe haven" story and more of a corrective phase as the overheating from late last year and early this year cools off.
- Crude oil, on the other hand, has surged nearly +50% on a 90-day basis,
- reflecting a combination of geopolitical risk,
- concerns about supply constraints,
- and expectations of an economic soft landing (steady oil demand).
What does this mean for investors?
- Gold and Silver: The correction over the past three months is difficult to explain by the inflation-hedge and safe-haven narrative alone.
→ Rising real interest rates, the level of the dollar, and the prior year's overheating must all be considered together; when deciding whether to increase or reduce gold and silver allocations, a "long-term diversification" perspective is important.
- Crude Oil: Having already risen sharply over 90 days, it is more important to prepare for expanded short-term volatility (in both directions) than to count on further gains.
---
## 6. Key Takeaways & Checkpoints for Today
### 6-1. Today's Key Points
1. Traditional Finance vs. Crypto: Diverging Paths
- U.S. stocks, bonds, and the dollar: a calm day, soft-landing expectations intact
- Bitcoin and Ethereum: sharp decline driven by ETF outflows + leveraged liquidations + geopolitical risk
2. The Big Picture on Rates and Inflation Remains Unchanged
- Policy rates, long-term rates, and real rates are on a gradual downtrend from their peaks
- Taking unemployment, industrial production, and inflation indicators together, the economy remains in "slowdown but not freefall" territory
3. AI·Big Tech Centered Quiet Strength Zone
- The Nasdaq 100's 90-day +22% rally is ongoing, but,
- Adjustment risks are also accumulating in the medium and long term considering high real interest rates and valuations.
### 6-2. Things to Check for the Next Few Days
- US Employment·Inflation Indicators:
→ If stronger than expected: Expectations for rate cuts could be pushed back, leading to bond weakness, dollar strength, and increased volatility in growth stocks.
→ If weaker than expected: Bond strength, dollar weakness, and a relief rally in high-risk assets are possible.
- Bitcoin ETF Fund Flows:
→ If outflows continue, today's decline may not be a mid-course adjustment but the beginning of a larger correction. (coinstats.app)
- Crude Oil and Geopolitical News:
→ If crude oil prices rise further, concerns about inflation reigniting could lead to delays in rate cuts.
---
## 7. Closing: Today's Quote
> "Stocks are quietly heading towards new highs, while Bitcoin is struggling amid headwinds from ETFs and leverage."
> It remains to be seen whether this asymmetric movement in risk assets will foreshadow the direction of the market in the second half of 2026.
This content is for informational purposes only and does not constitute investment advice for any specific security or asset.
Source: https://nextinvest.org/ko
Free to share ^^